

Kwinana
3 Bin Waste Deception
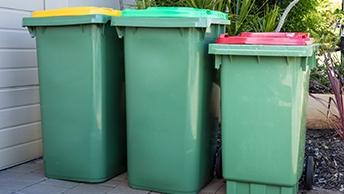
Zero Accountability: The Great Kwinana Waste Deception
The City of Kwinana’s recent waste overhaul was promised as a modern upgrade, but it has turned into a costly headache for local households. Instead of better services, ratepayers are stuck with smaller bins, junk rotting on suburban verges, and a 4.5% rate hike—all while the council refuses to take responsibility.
| WASTE SERVICE COMPARISON | ||
| Service Element | Legacy System | New Waste Strategy |
| │ General Waste Bins | 240L Capacity | 140L Capacity (Slashed) |
| Verge Pickups | 4 Scheduled Suburb Sweeps/Yr unlimited size | 2 Pre-Booked Pickups/Yr Limited size |
| System Status | Clean Verges, Proven System | Verge Rubbish Left Months |
The Fake Choice
When the council first pushed the new 3-bin system, they claimed local families asked for it, citing a community survey. But as soon as the rollout sputtered and residents voiced outrage over slashed bin capacities, the narrative changed overnight. Council leaders dropped the survey excuse and pointed fingers at Roger Cook’s WA Government, claiming it was an unavoidable state mandate. The survey was nothing more than a cover story to make a forced decision look like community demand.
The Decision Makers
On June 28, 2023, these councillors voted yes to this whole scheme—basing a massive decision on a survey of just 896 people in a city of over 45,000:
- Mayor Carol Adams (Former Mayor)
- Peter Feasey (Current Mayor)
- Barry Winmar
- David Acker
- Matthew Rowse
- Sherilyn Wood
- Michael James Brown
The majority of these representatives are still in office today. When locals ask why rubbish sits on verges for months, sitting councillors dodge questions and pass the buck to the CEO and administrative staff. By refusing to own this failure, they are actively shielding state politicians from backlash rather than fighting for the residents who elected them.
Squandering Ratepayer Dollars
Worse still is the deliberate squandering of local funds. Kwinana Council poured ratepayer dollars into a promotional campaign featuring custom website materials, mail out to every house hold, extra promotional staffing, and community vouchers to sell a pre-determined outcome.
Ratepayer money was spent aggressively advertising a “choice” that was going to be forced onto households regardless of resident concerns or practical reality.
How the Service Has Failed Households
- Slashed Bin Capacity: General waste capacity dropped from 240L to 140L, leaving larger families struggling with weekly bin overflow.
- Gutted Verge Pickups: Four scheduled, suburb-wide cleans a year were reduced to just two individual load limited sizes, pre-booked pickups.
- Logistical Mess: Heavy collection trucks now make hundreds of erratic trips to individual houses, burning extra fuel and wasting ratepayer cash.
- Visual Blight: Uncollected household waste sits deteriorating on neighborhood verges for months at a time.
Five Years of Financial Mismanagement
Kwinana’s cumulative rate hikes over the last five years (~21.75%) vastly outpace neighboring councils like Rockingham (~13.9%) and Cockburn (~14.3%), both of which froze rates during economic hardship while delivering superior infrastructure.
| Year | Kwinana Council | Rockingham Council | Cockburn Council |
|---|---|---|---|
| 2025/26 | 4.5% 🚩 | 3.5% | 3.5% |
| 2024/25 | 5.0% | 3.9% | 4.4% |
| 2023/24 | 4.75% | 3.5% | 3.9% |
| 2022/23 | 4.0% | 3.0% | 2.5% |
| 2021/22 | 3.5% | 0.0%* | 0.0%* |
| 5-Year Total | ~21.75% | ~13.9% | ~14.3% |
*Note: Neighboring councils froze rates during Covid while Kwinana pushed ahead with increases.
Our elected representatives were chosen to stand up for Kwinana ratepayers, not act as a rubber-stamp arm for state directives.
It is time for Kwinana Council to stop running protection for Roger Cook’s state government, acknowledge this rollout’s failure, and restore our previous functional waste services.